Quick Start Guide for Team Leads
Welcome to Vela! This guide will get you up and running as a Team Lead or Manager in 30 minutes. By the end, you'll know how to monitor performance, review interactions, and start coaching your team effectively.
As a Team Lead, you have comprehensive access to monitor and manage your team's performance. You can review interactions, generate reports, create training programs, and track coaching effectiveness—all powered by AI insights that make quality assurance faster and more effective.
What You'll Learn
- ✅ How to log in and navigate the platform
- ✅ Check today's team performance at a glance
- ✅ Upload and review your first call or chat
- ✅ Set up automated monitoring with Smart Search
- ✅ Understand key metrics and their meanings
- ✅ Provide feedback to agents
Estimated time: 30 minutes
Before You Begin
What You Need
- Active Vela account - Your administrator should have created your account
- Login credentials - Email verification link or SSO access
- Supported browser - Chrome (recommended), Firefox, Safari, or Edge
- Sample call recording (optional) - For practicing uploads (WAV or MP3 format)
Understanding Your Access Level
Your administrator assigned you one of these access levels:
| Access Level | What You Can See |
|---|---|
| Organisational | All departments and teams across the organisation |
| Departmental | All teams within your specific department |
| Team | Only your immediate team's data |
Check your email for a verification link from Vela. Click it to activate your account and set your password before proceeding.
Step 1: Log In to Vela (2 minutes)
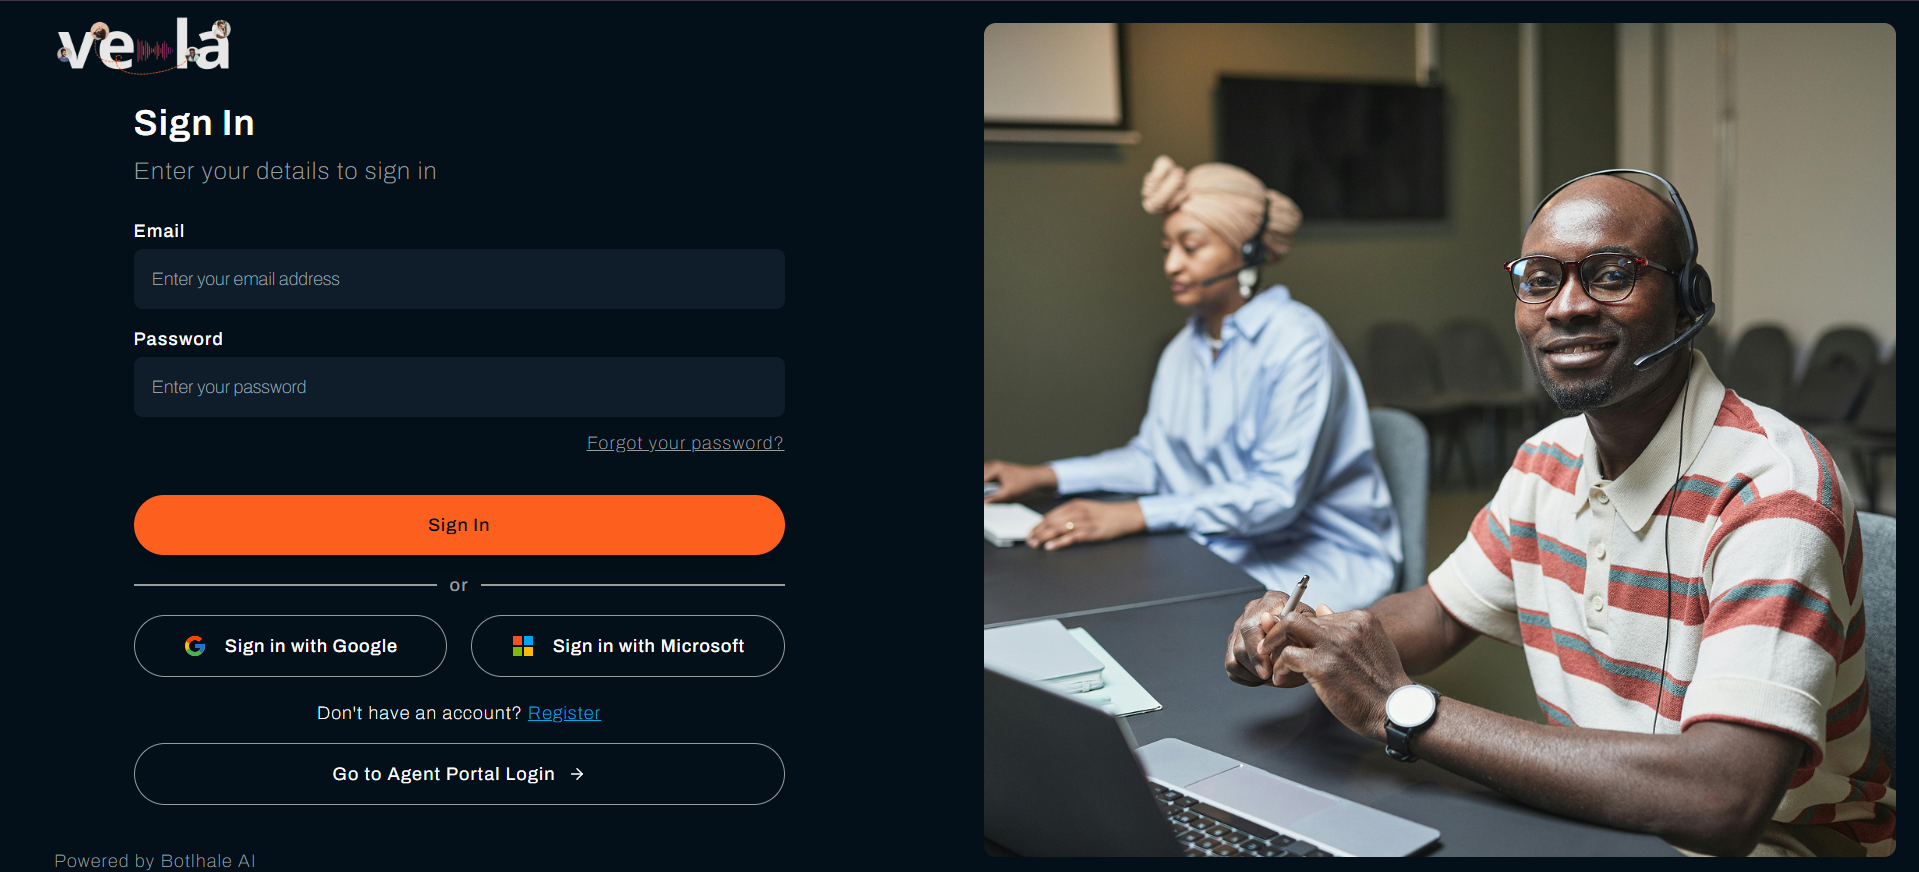
Accessing the Platform
- Navigate to your Vela login page (provided by your administrator)
- Choose your authentication method:
Option A: Single Sign-On (SSO)
- Click "Sign in with Google" if using Google Workspace
- Click "Sign in with Microsoft" if using Azure AD
- Follow your organisation's authentication flow
Option B: Email and Password
- Enter your email address
- Enter your password
- Click "Log In"
First-Time Password Setup
If this is your first login, you'll need to create a password that meets these requirements:
- ✓ At least 8 characters
- ✓ At least one letter
- ✓ At least one number
- ✓ At least one special character (@, #, $, etc.)
Example: VelaTeam2024!
What You'll See After Login
After logging in, you'll land on your Dashboard - your command center for monitoring team performance. The left sidebar shows your main navigation areas.
 ]
]
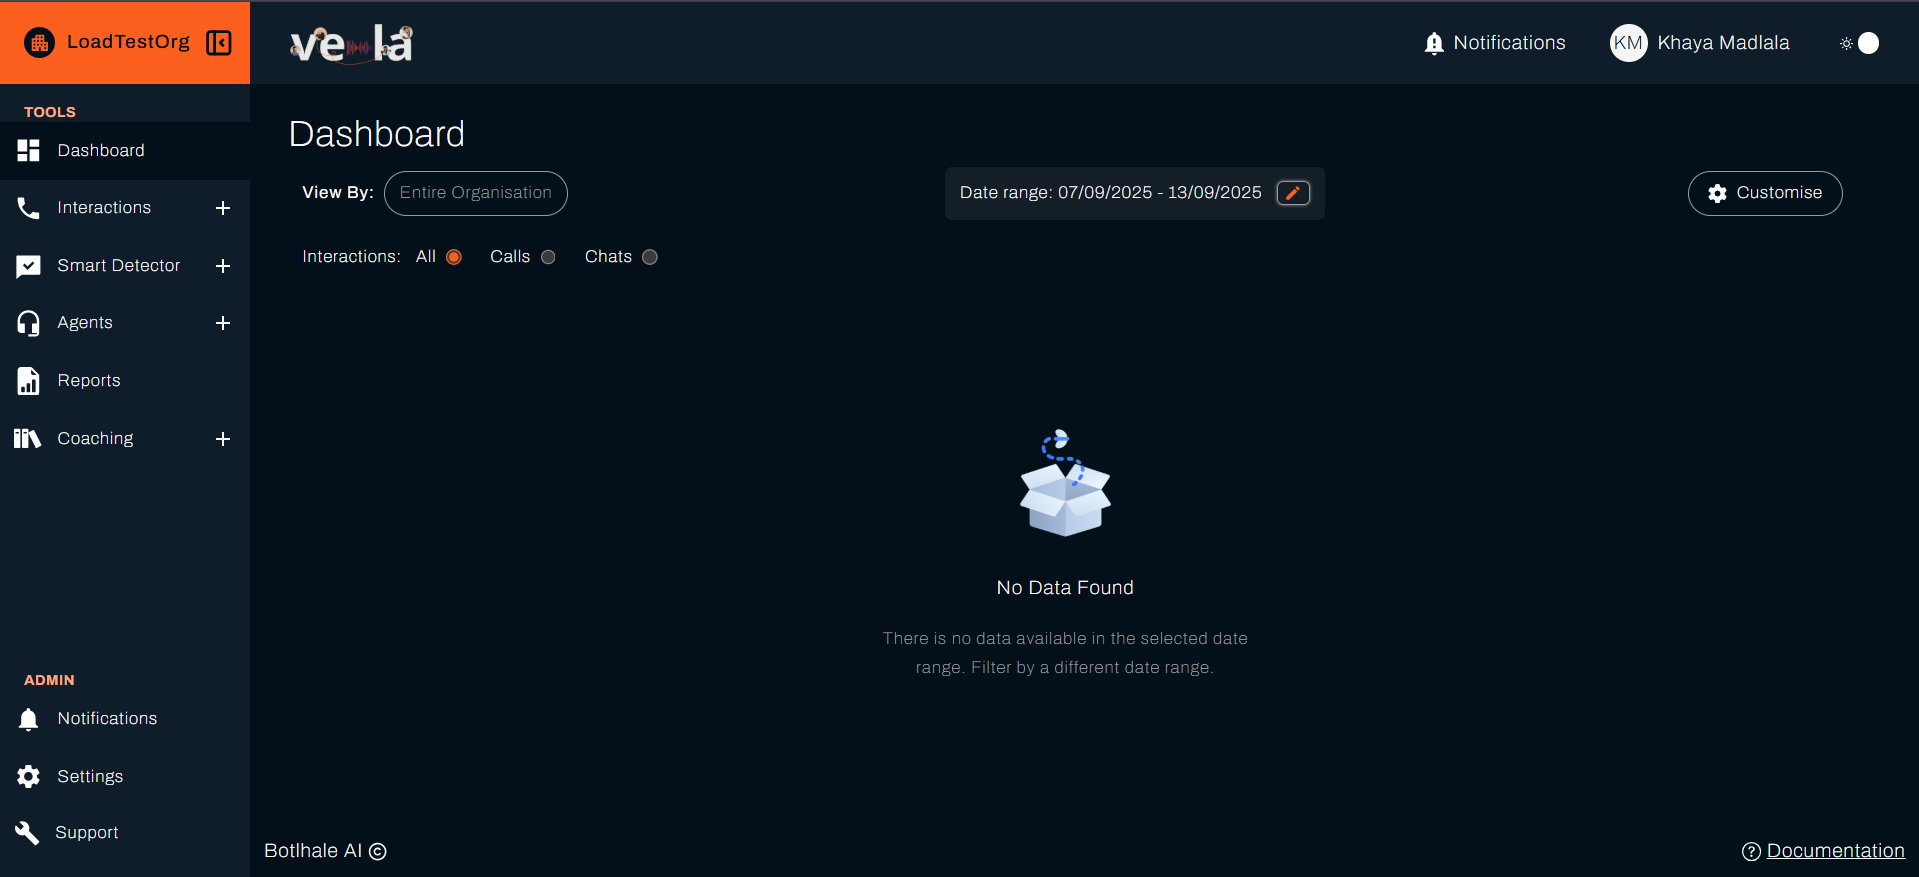
Step 2: Understand Your Dashboard (5 minutes)
Dashboard Overview
Your Dashboard provides an overview of your team’s performance.
If no calls or chats have been uploaded in your organization yet, performance data will not be available. In that case, skip ahead to Step 3, and you can return to this step once data is available.
Let’s explore the key components of the Dashboard:
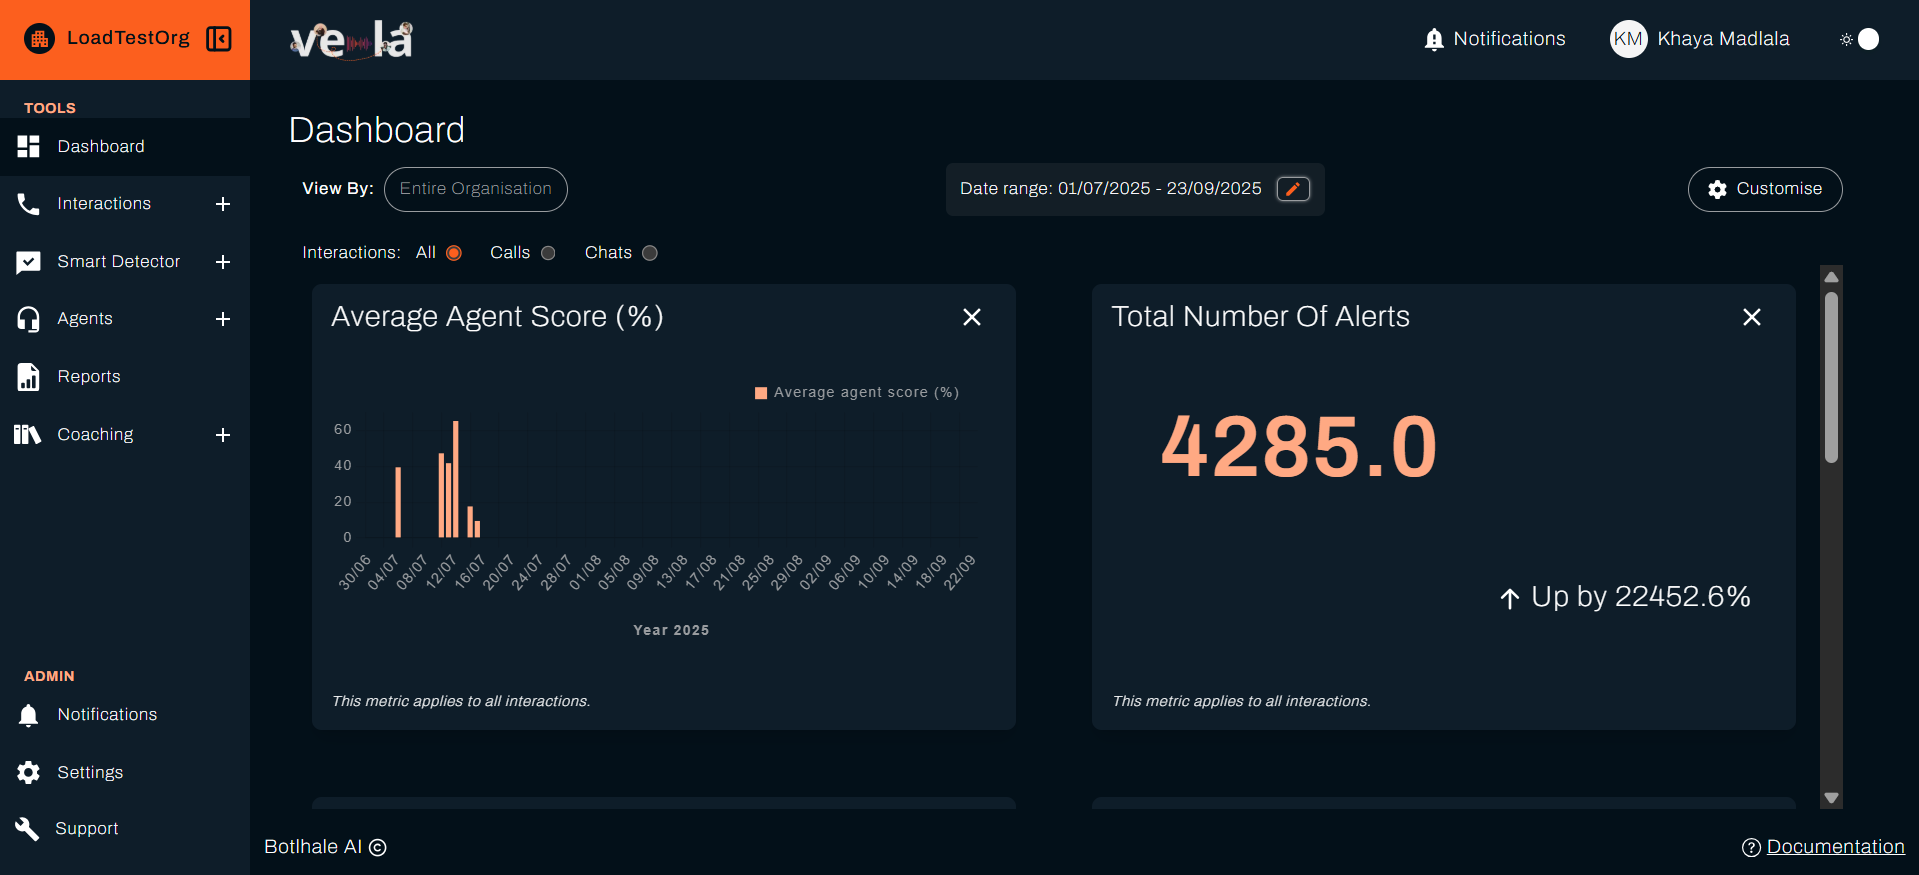
Essential Controls
Date Range Selector (Top Center)
- Quick options: Today, Yesterday, This Week, Last Week, This Month, Last Month
- Custom range: Select specific start and end dates
- Try it now: Set the date range to "Today" to see current performance
Scope Filter (Top left)
- Organisation view: See all teams
- Department view: Focus on specific departments
- Team view: Focus on a specific teams only
- Try it now: Ensure you're viewing your team's scope
Interaction Type Filter (Top left, below Scope Filter)
- All: Calls and chats combined
- Calls only: Voice interactions
- Chats only: Text-based interactions
Key Metrics to Monitor
Your dashboard displays critical performance indicators. Here are the most important ones:
Performance Quality Metrics
Average Agent Score
- What it is: Overall team performance rating (0-100 scale)
- What to look for:
- (80+): Excellent performance
- (60-79): Good with room for improvement
- Why it matters: Quick indicator of overall team quality
Agent Scores Distribution
- What it is: Histogram showing how your agents' scores are spread
- What to look for: Are scores clustered or widely spread?
- Why it matters: Identifies consistency and outliers needing attention
Talk to Listen Ratio
- What it is: Amount of time agents spend talking vs. listening
- Typical good range: 0.7 - 1.2 (varies by industry)
- What to look for: Very high ratios may indicate agents not listening enough
- Why it matters: Balance is key to effective communication
Volume and Efficiency Metrics
No. Calls / No. Chats
- What it is: Total interactions handled in selected time period
- Why it matters: Understand workload and capacity
Ave Call Duration
- What it is: Average length of customer interactions
- Why it matters: Efficiency indicator (but longer isn't always bad if quality is high)
Average Silent Time
- What it is: Average silence during interactions
- What to look for: High values may indicate knowledge gaps or system issues
Alert and Issue Tracking
No. Alerts
- What it is: Total issues flagged by AI or Smart Search
- Types include: Compliance violations, negative sentiment spikes, keyword triggers
- Why it matters: Shows volume of issues requiring your attention
Resolved vs. Unresolved Alerts
- What it is: How many flagged issues have been addressed
- Why it matters: Tracks your team's responsiveness to problems
Customer Experience Metrics
Sentiment Distribution
- What it is: Breakdown of customer emotions (Positive, Neutral, Negative)
- What to look for: High negative sentiment percentages
- Why it matters: Direct measure of customer satisfaction
Pain Point Distribution
- What it is: Common customer frustrations identified by AI
- Why it matters: Shows what's bothering your customers most
Start each day by checking these three metrics:
- Average Agent Score - Overall team health
- No. Alerts - Issues requiring immediate attention
- Sentiment Distribution - Customer satisfaction trends
Customising Your Dashboard
You can customise/choose which metrics appear on your dashboard:
- Click "Customise" button
- Select metrics from the available list (30+ options)
- Choose chart types - Table, Bar, Line, Pie, or Donut
- Drag and drop to arrange layout
- Save your configuration

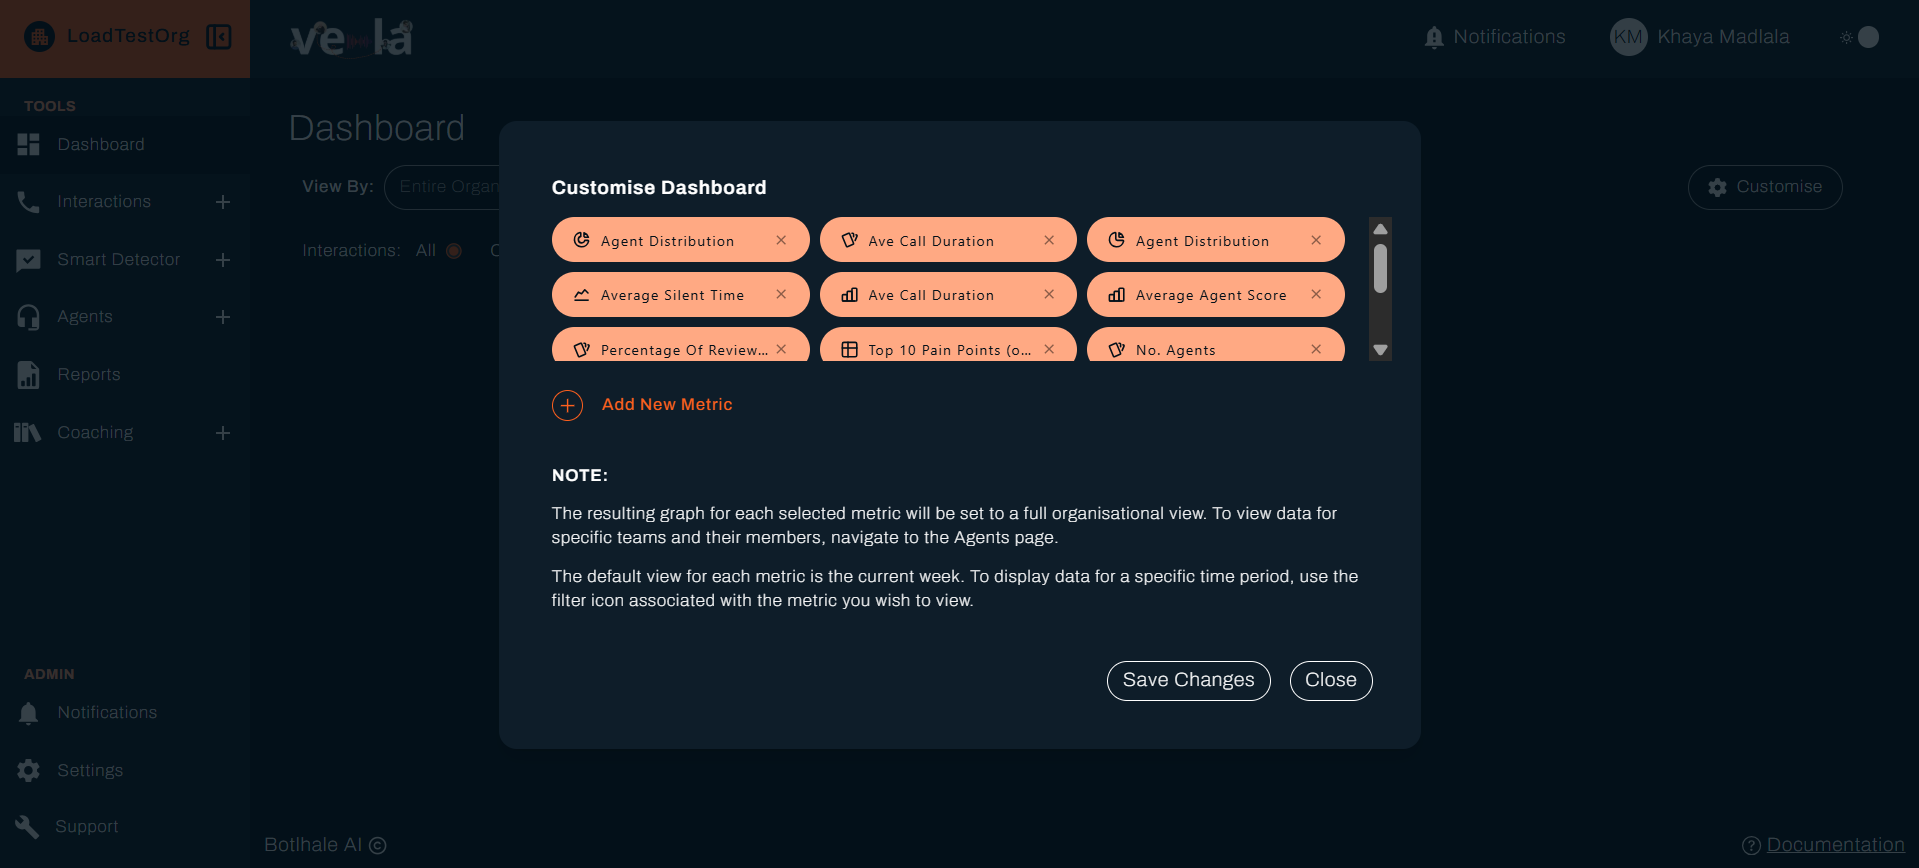
Try it now: Add "Top 10 Pain Points" to your dashboard to monitor common customer issues.
Step 3: Upload and Review Your First Interaction (10 minutes)
Let's walk through uploading and analyzing a call to understand how Vela's AI provides quality insights.
Uploading a Single Call
-
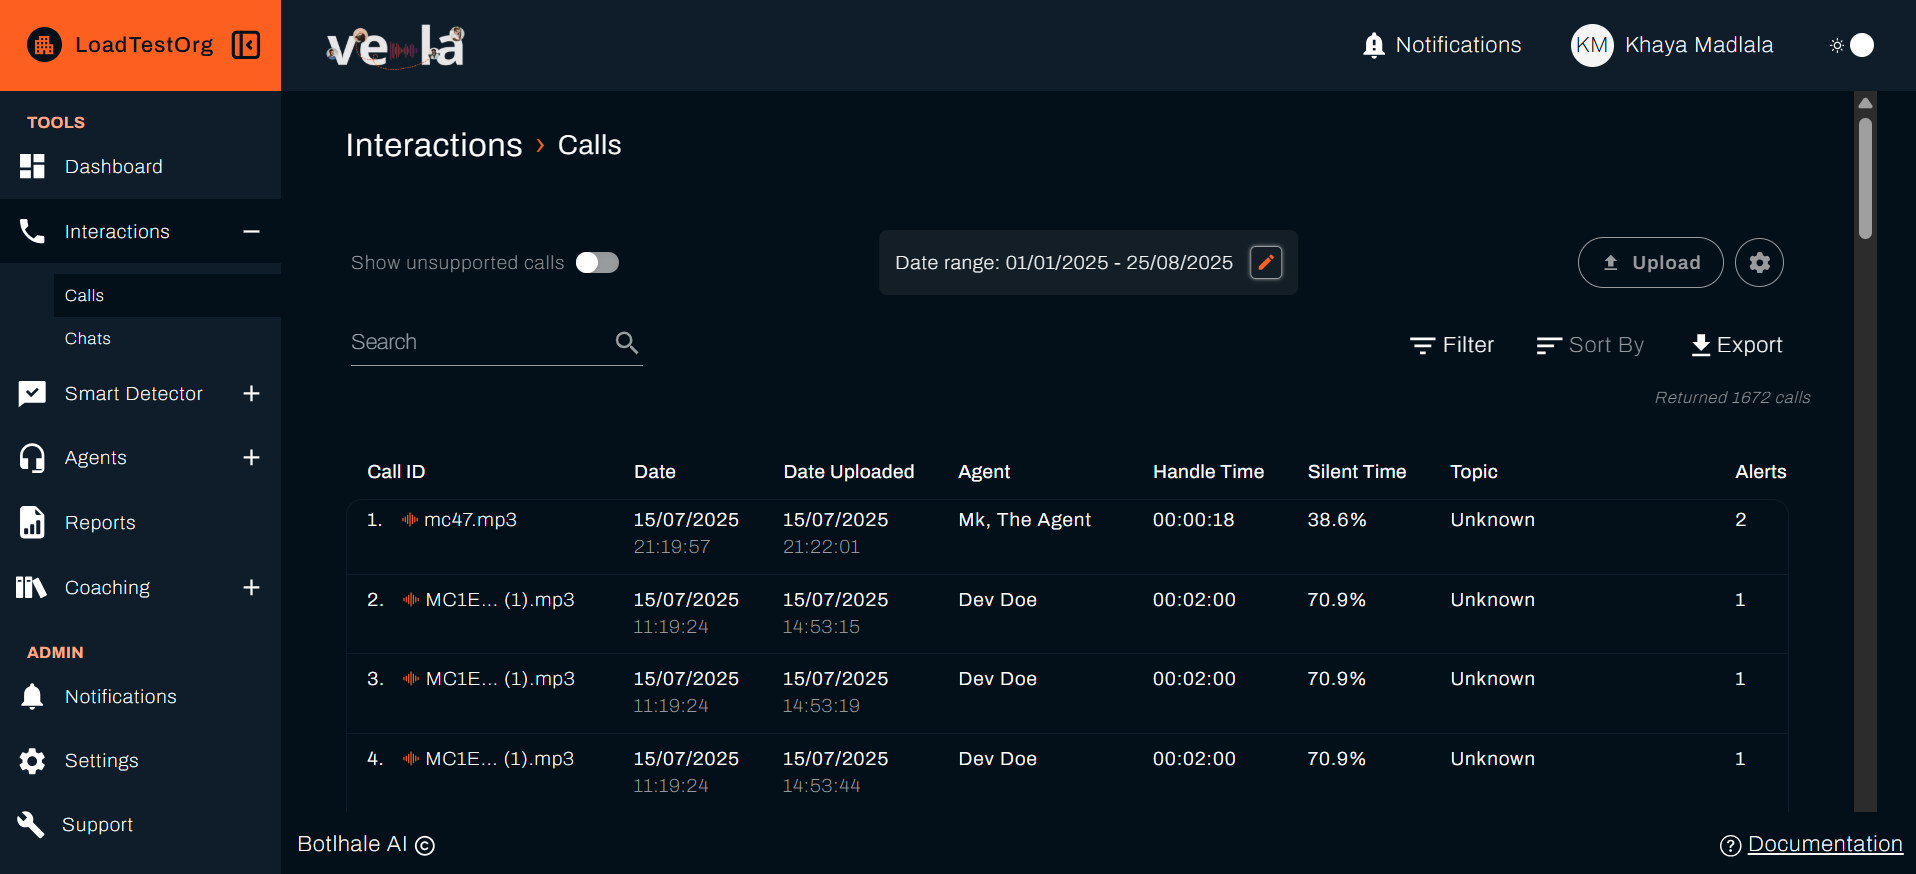
Navigate to Interactions
- Click "Interactions" in the left sidebar
- Select "Calls" tab
-
Click "Upload Single Call"
-
Fill in the upload form:
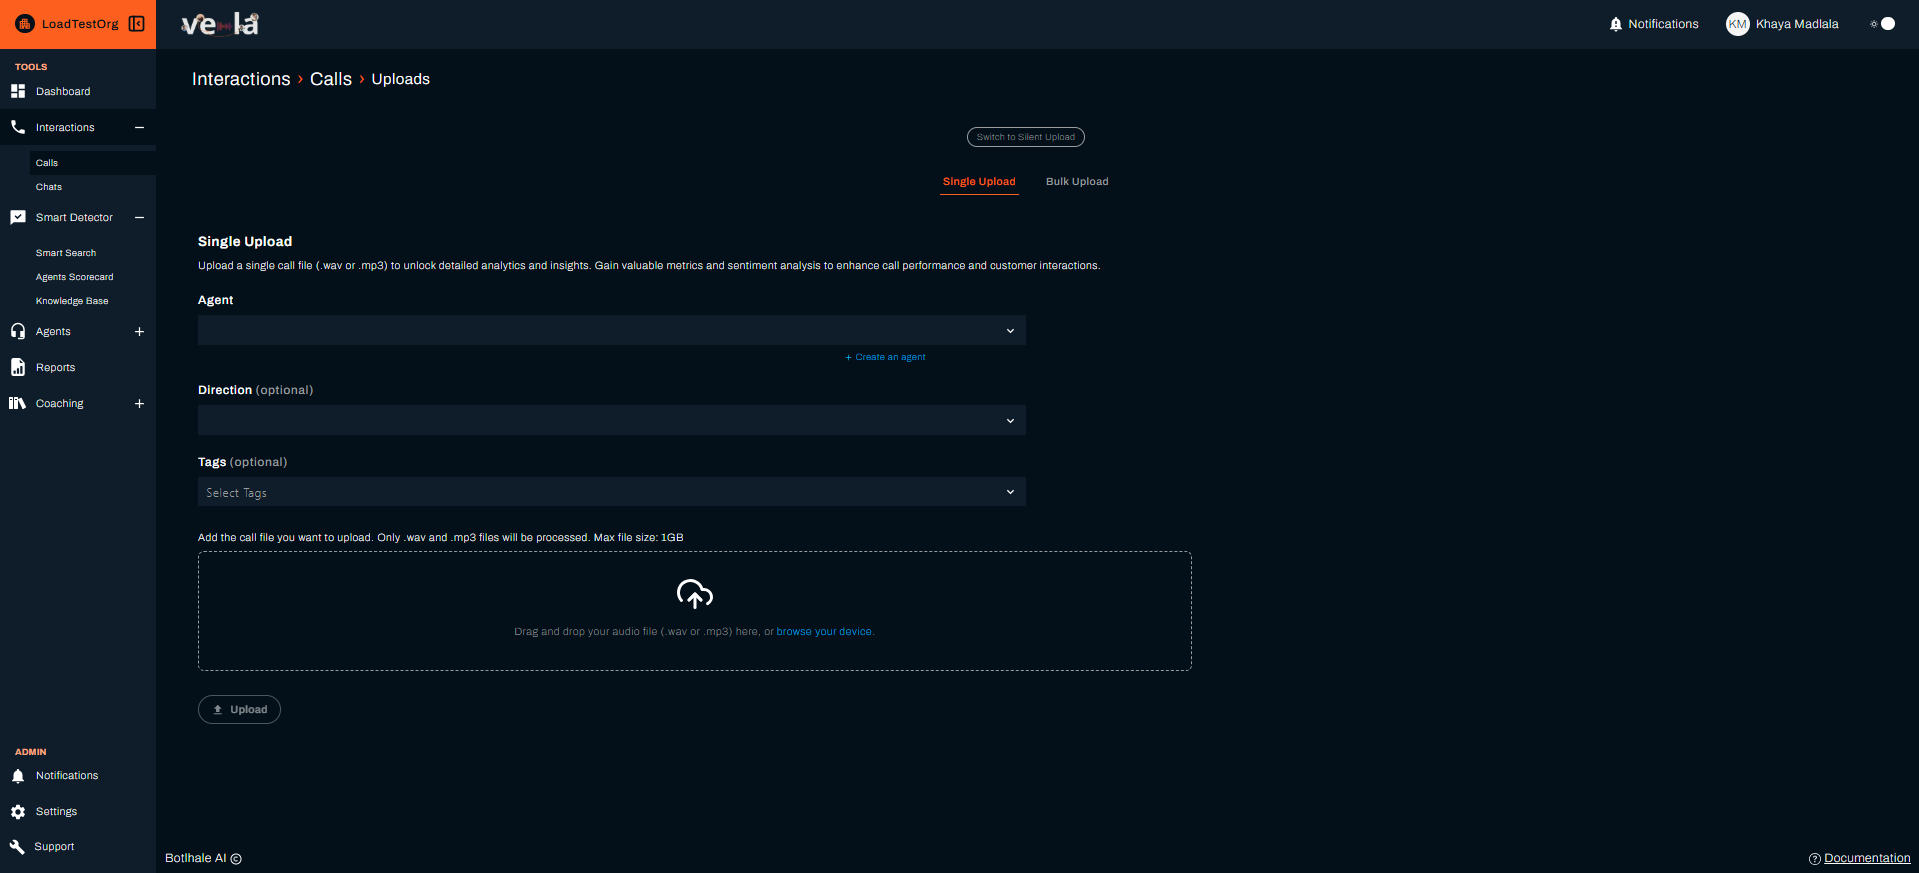
Required Fields:
- Agent: Select the agent who handled this call (dropdown filtered by your access)
- Direction: Choose "Inbound" or "Outbound"
- Tags: (Optional but recommended) Add labels like "complaint", "sales", "billing"
- Use semicolons to separate:
complaint;billing;escalation
- Use semicolons to separate:
-
Upload your audio file:
- Click "Browse" to select file OR
- Drag and drop the audio file into the upload area
- Supported formats: WAV or MP3
-
Click "Upload"
Processing Time
You'll see a processing indicator. Typical times:
- Standard calls (5-15 min): 1-3 minutes
- Long calls (15+ min): 3-10 minutes
Vela's AI is transcribing the call, identifying speakers, analyzing sentiment, detecting keywords, classifying intent, identifying pain points, and generating an automatic quality scorecard—all simultaneously!
Reviewing the AI Analysis
Once processing completes, click on your uploaded interaction to see the analysis:
1. Interaction Summary
AI-Generated Overview:
- Main topic of conversation
- Key issues discussed
- Resolution status
- Overall interaction outcome
Example:
"Customer called regarding billing discrepancy on their August invoice. Agent identified the issue as a promotional discount not applied correctly. Issue resolved by applying the discount retroactively and issuing a credit. Customer expressed satisfaction with the resolution."
2. Transcription
Full text of the conversation with:
- Speaker identification (Agent vs. Customer)
- Timestamps for each statement
- Searchable text (use Ctrl+F to find specific words)
- Confidence indicators (how certain the AI is about the transcription)
Navigation tips:
- Click on any timestamp to jump to that moment in the audio
- Use the search function to find specific keywords or phrases
- Review transcription quality—flag any major errors for system improvement
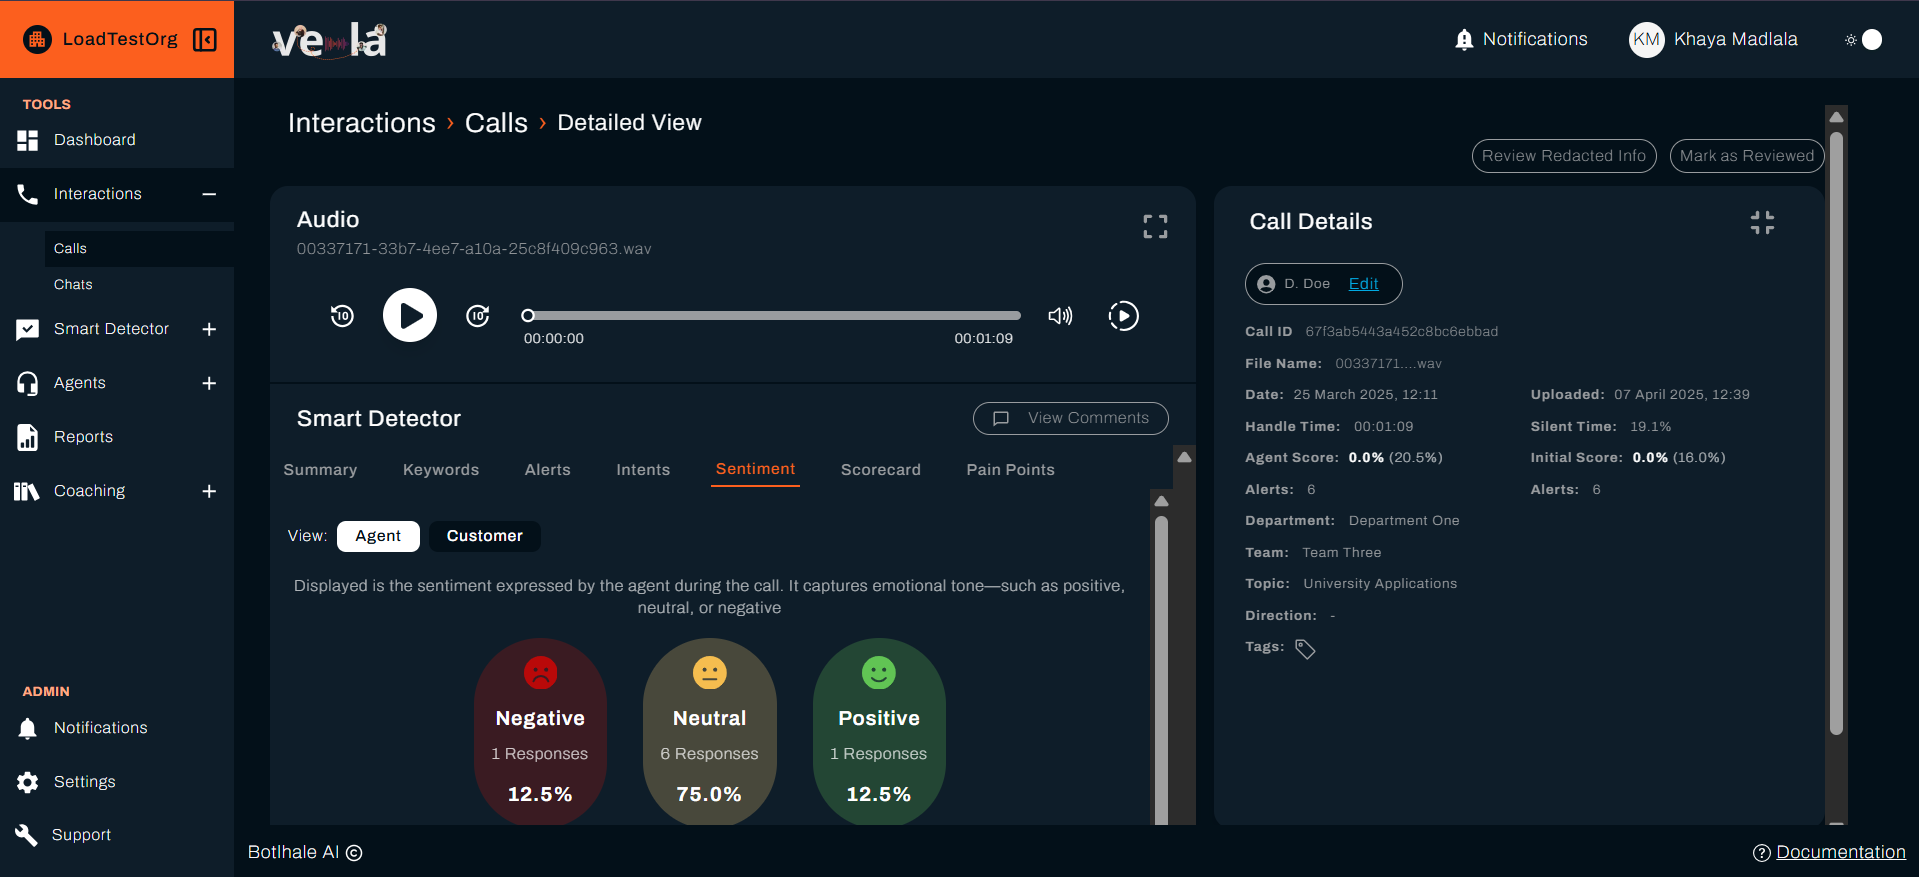
3. Sentiment Analysis
Visual sentiment journey showing:
- Overall sentiment (Positive, Neutral, Negative)
- Sentiment changes throughout the conversation
- Critical moments where customer mood shifted
- Agent's impact on customer sentiment
What to look for:
- Did the agent improve negative sentiment?
- Where did sentiment deteriorate, and why?
- Overall trajectory. Did interaction end positively?
4. Keywords Detected
Important terms and phrases identified:
- Compliance-related keywords (if configured)
- Product/service mentions
- Action items and commitments
- Sentiment-bearing words
Example keywords:
- "refund", "frustrated", "manager", "resolved", "thank you"
5. Alerts
Issues flagged by Smart Search or Vela AI:
- Compliance violations: Missed required procedures or scripts
- Negative escalations: Customer dissatisfaction or complaints
- Quality concerns: Long hold times, unprofessional language
- Positive highlights: Excellent service, successful resolution
Alert priority levels:
- 🔴 Critical - Immediate attention required
- 🟠 High - Review within 24 hours
- 🟡 Medium - Standard review needed
- 🟢 Low - Informational only
6. Intent Classification
Customer's purpose for the interaction:
- Support request
- Sales inquiry
- Billing question
- Complaint or escalation
- Information request
Why it matters: Helps you understand if agents are handling different intent types effectively.
7. Automatic Scorecard
AI evaluation based on your organisation's scorecard/criteria:
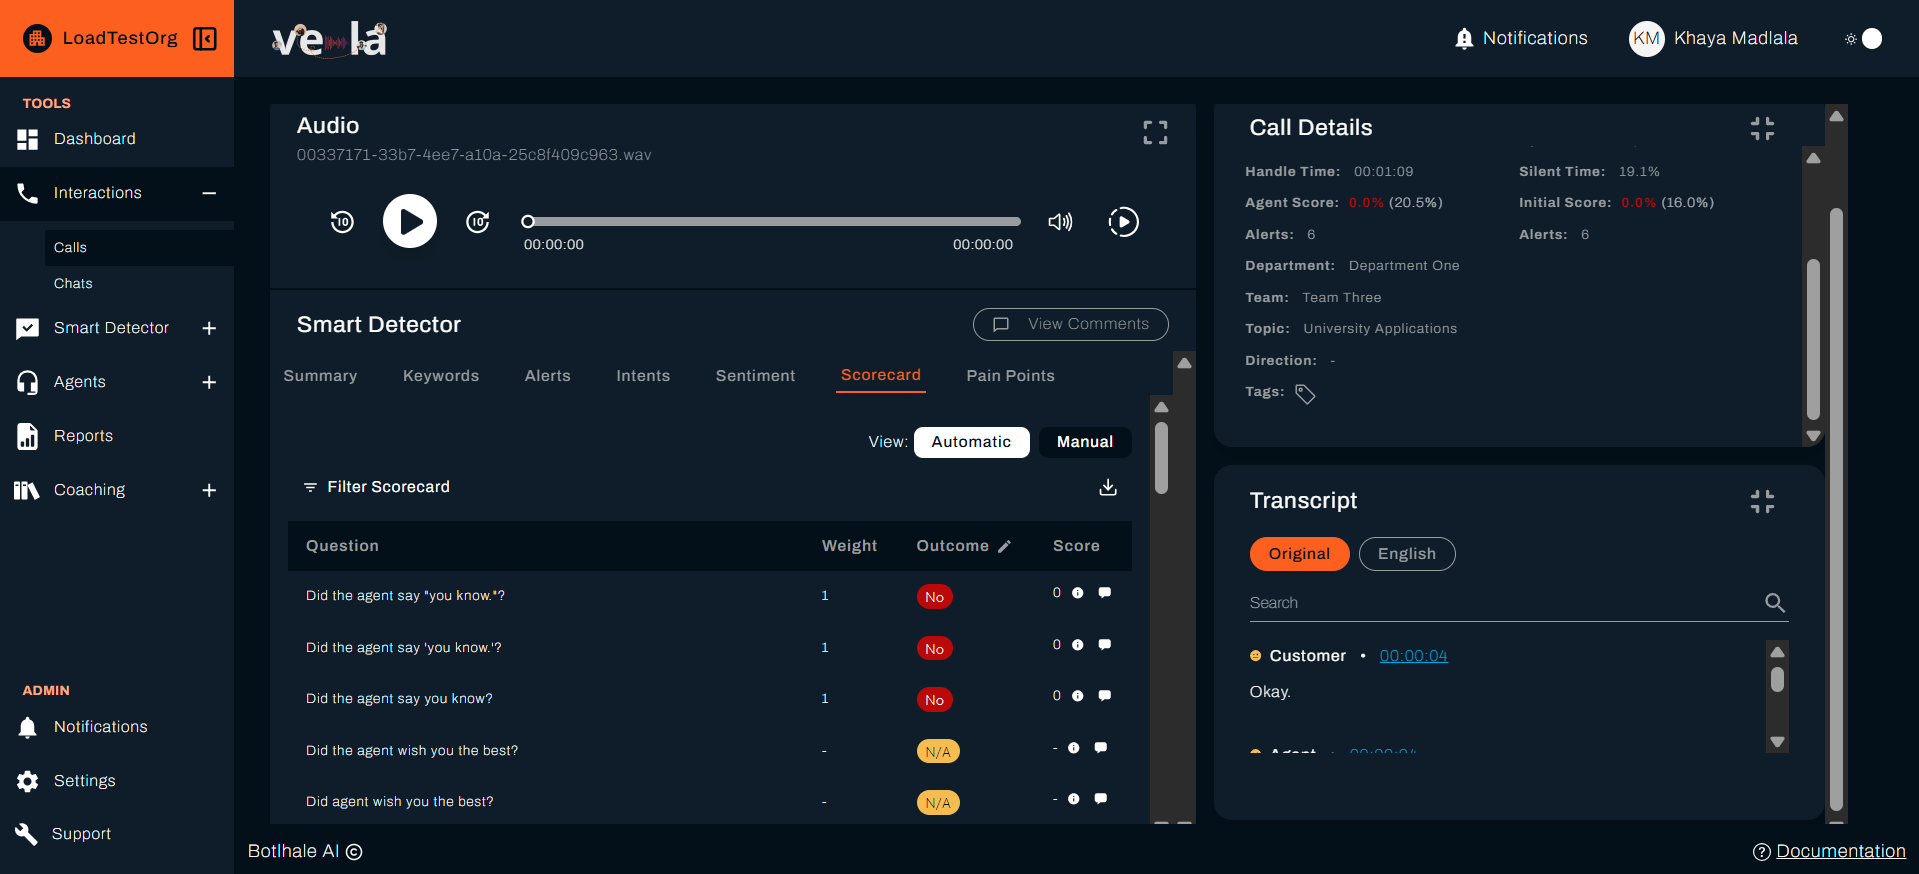
Typical categories:
- Communication Skills - Clarity, professionalism, tone
- Problem Resolution - Issue identification and solution quality
- Compliance Adherence - Following procedures and scripts
- Customer Experience - Courtesy, empathy, satisfaction
Each category shows:
- Score (0-100)
- Specific observations
- Strengths and improvement areas
8. Pain Points
Customer frustration indicators detected:
- Long wait times
- Repeated explanations required
- System or process issues
- Unresolved problems
Example pain points:
- "Customer had to explain the issue multiple times"
- "Extended hold time of 4 minutes"
- "System error prevented first-attempt resolution"
Adding Your Feedback
After reviewing the AI analysis, add your own observations:
- Scroll to the Comments section
- Click "Add Comment"
- Write specific feedback:
Good feedback example:
Great job handling this difficult customer, @Sarah / @Agent! I particularly liked how you:
-Remained calm when the customer raised their voice -Took ownership of the issue immediately -Offered a clear solution with timeline
- Tag the agent (they'll receive a notification. If you don't use the @Agent tag, the comment will be seen by team leaders only)
- Send your comment
- Be specific - Reference exact moments in the interaction
- Be actionable - Provide clear next steps
- Balance positive and constructive - Acknowledge strengths, suggest improvements
Creating a Manual Scorecard (Optional)
If you disagree with the Vela AI's assessment, you can override it:
- Click "Create Manual Scorecard"
- Evaluate each category using your judgment
- Add detailed comments explaining your scores
- Submit - This replaces the AI scorecard
When to use manual scoring:
- AI missed important context or nuance
- Cultural or language subtleties not captured by AI
- Complex situations requiring human judgment
Step 4: Set Up Your First Smart Search (10 minutes)
Smart Search automatically monitors all interactions for specific keywords, phrases, or patterns. This is essential for compliance monitoring and proactive quality management.
Creating a Compliance Monitor
Let's create a Smart Search to monitor refund-related conversations:
-
Navigate to Smart Detector
- Click "Smart Detector" in the left sidebar
- Select "Smart Search" tab
-
Click "Create New Smart Search"
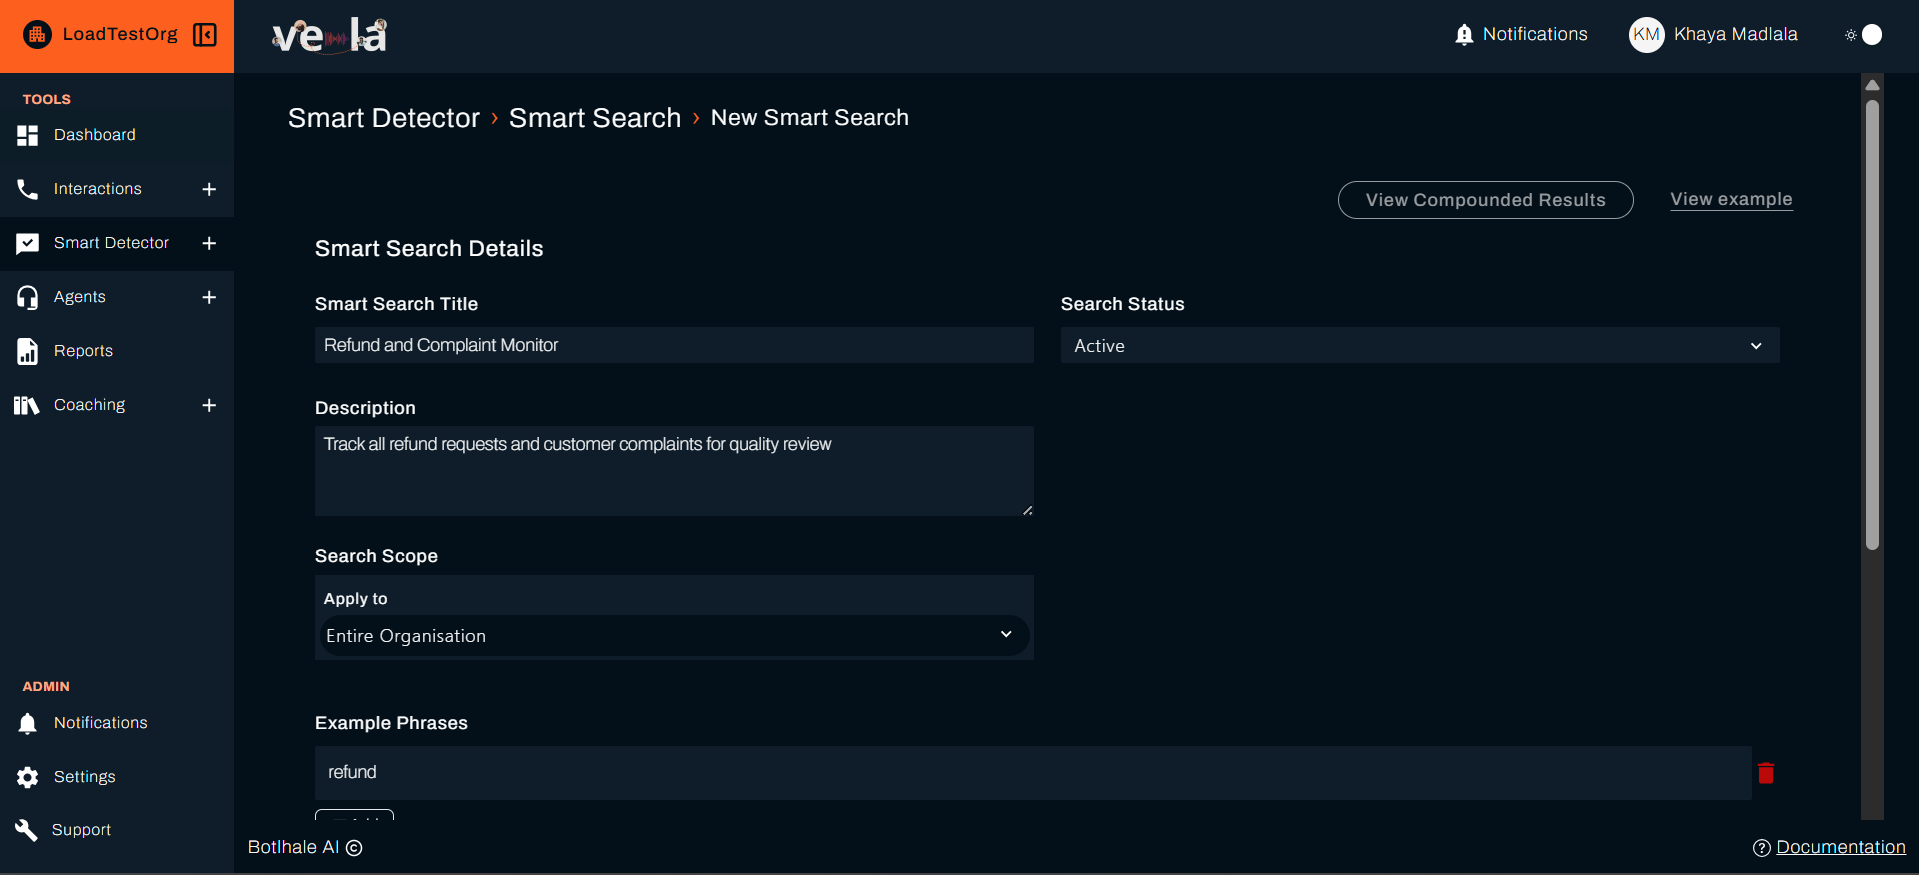
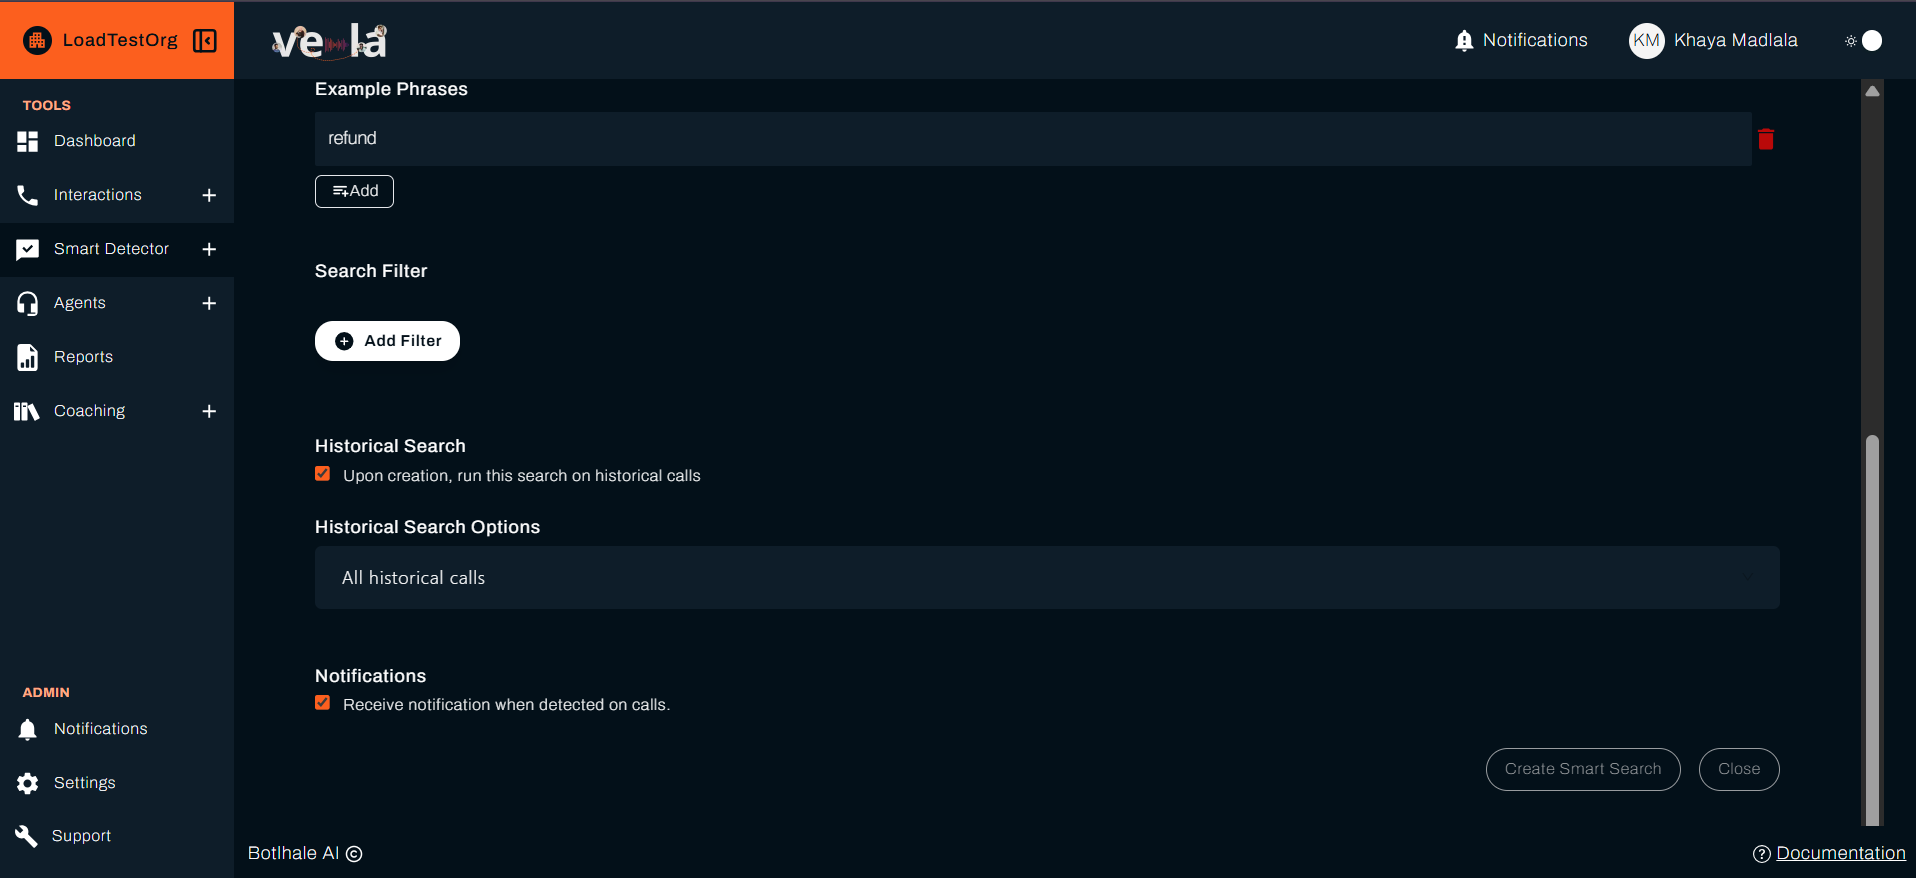
- Configure your search:
Title: Refund Request Monitor
Description: